Data Visualization
With the rise of corporate mobile access, tracking adoption has become ever more important. Before design systems, this work used playful colors and engaging dynamic interactions
Real-time understanding of mobile devices at IBM
While working with the Mobile@IBM Operations Squad it became clear that we needed to have a better way to track the growth of mobile adoption.
We also needed to understand what the the devices were and what operating systems they ran so that we can keep the networks secure. Since I have been conducting Design Thinking Workshops in many parts of IBM, I suggested we run one with the key members of the team who have been tracking mobile phone adoption within IBM
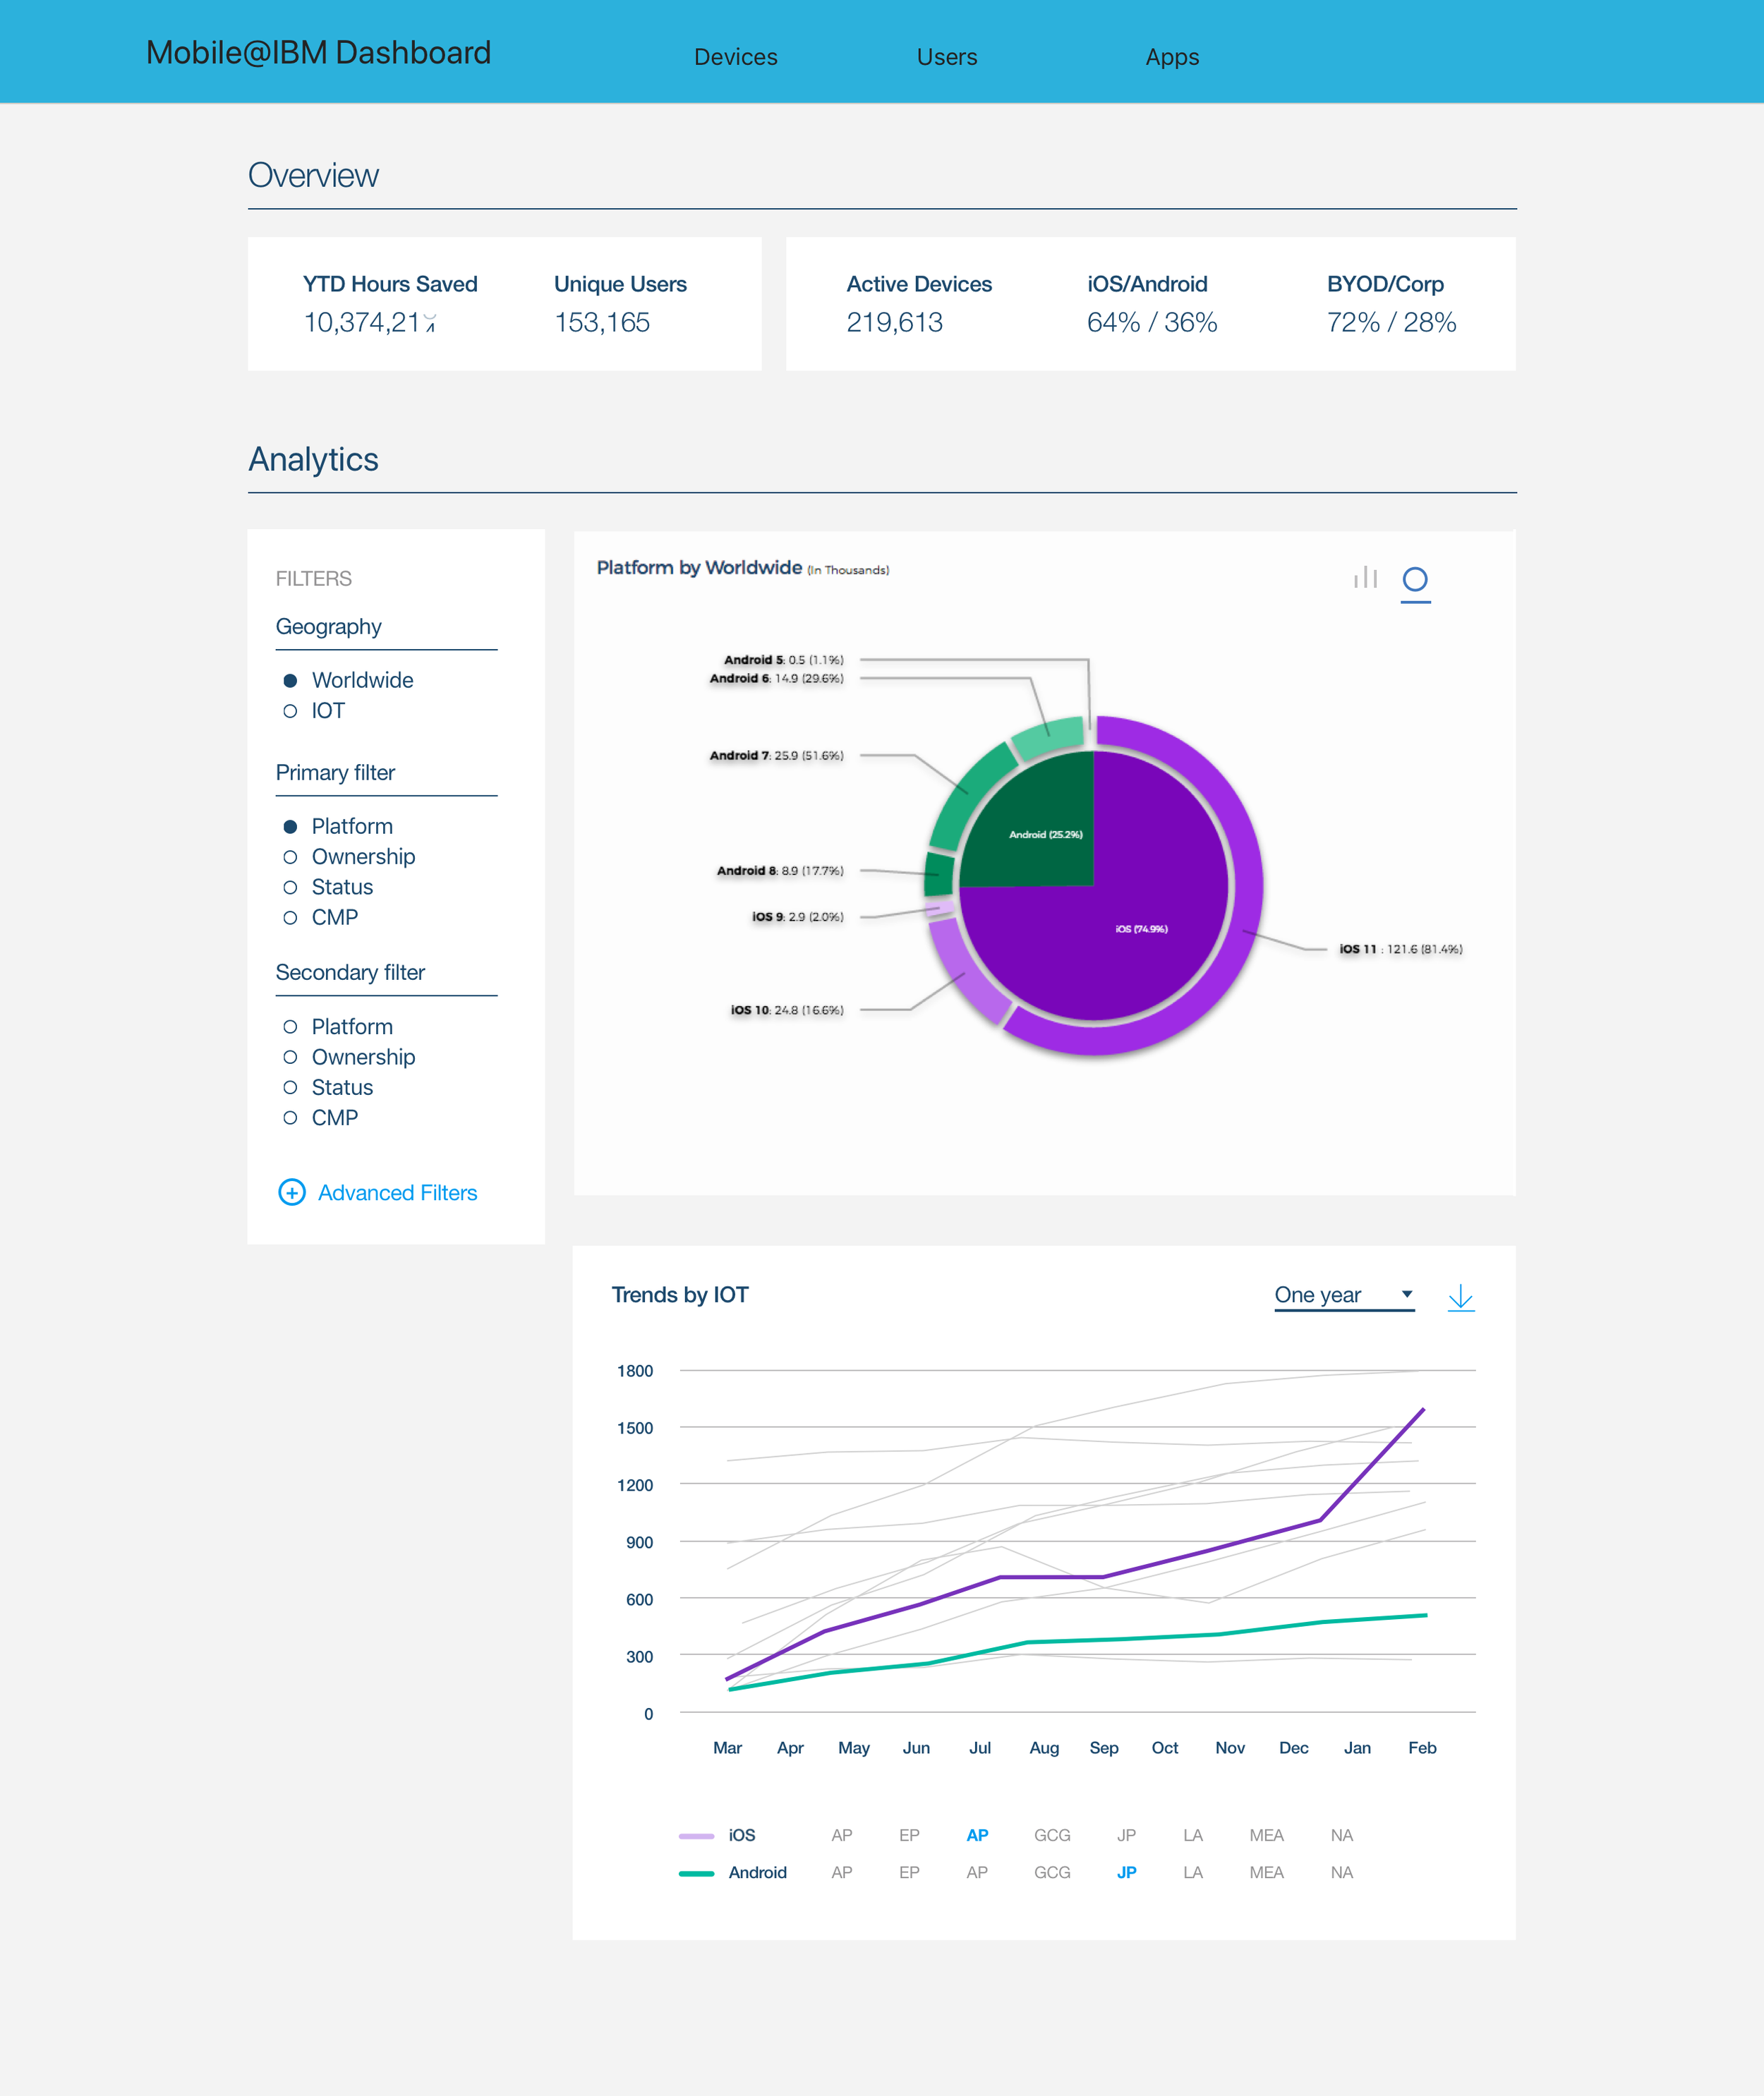
The result was a dashboard that pulled data from our current databases so that the Mobile@IBM team and the CIO could quickly see the current state of mobile devices at any time. Previously this would take over a week and consuming people’s time to gather this data, which they did quarterly.
Now, not only is the information better and easier to understand, it is always available without taking time away from other important tasks.
Design Thinking Workshop
Multiple stakeholders
Varied interests
Cohesive solution and buy-in

Solution
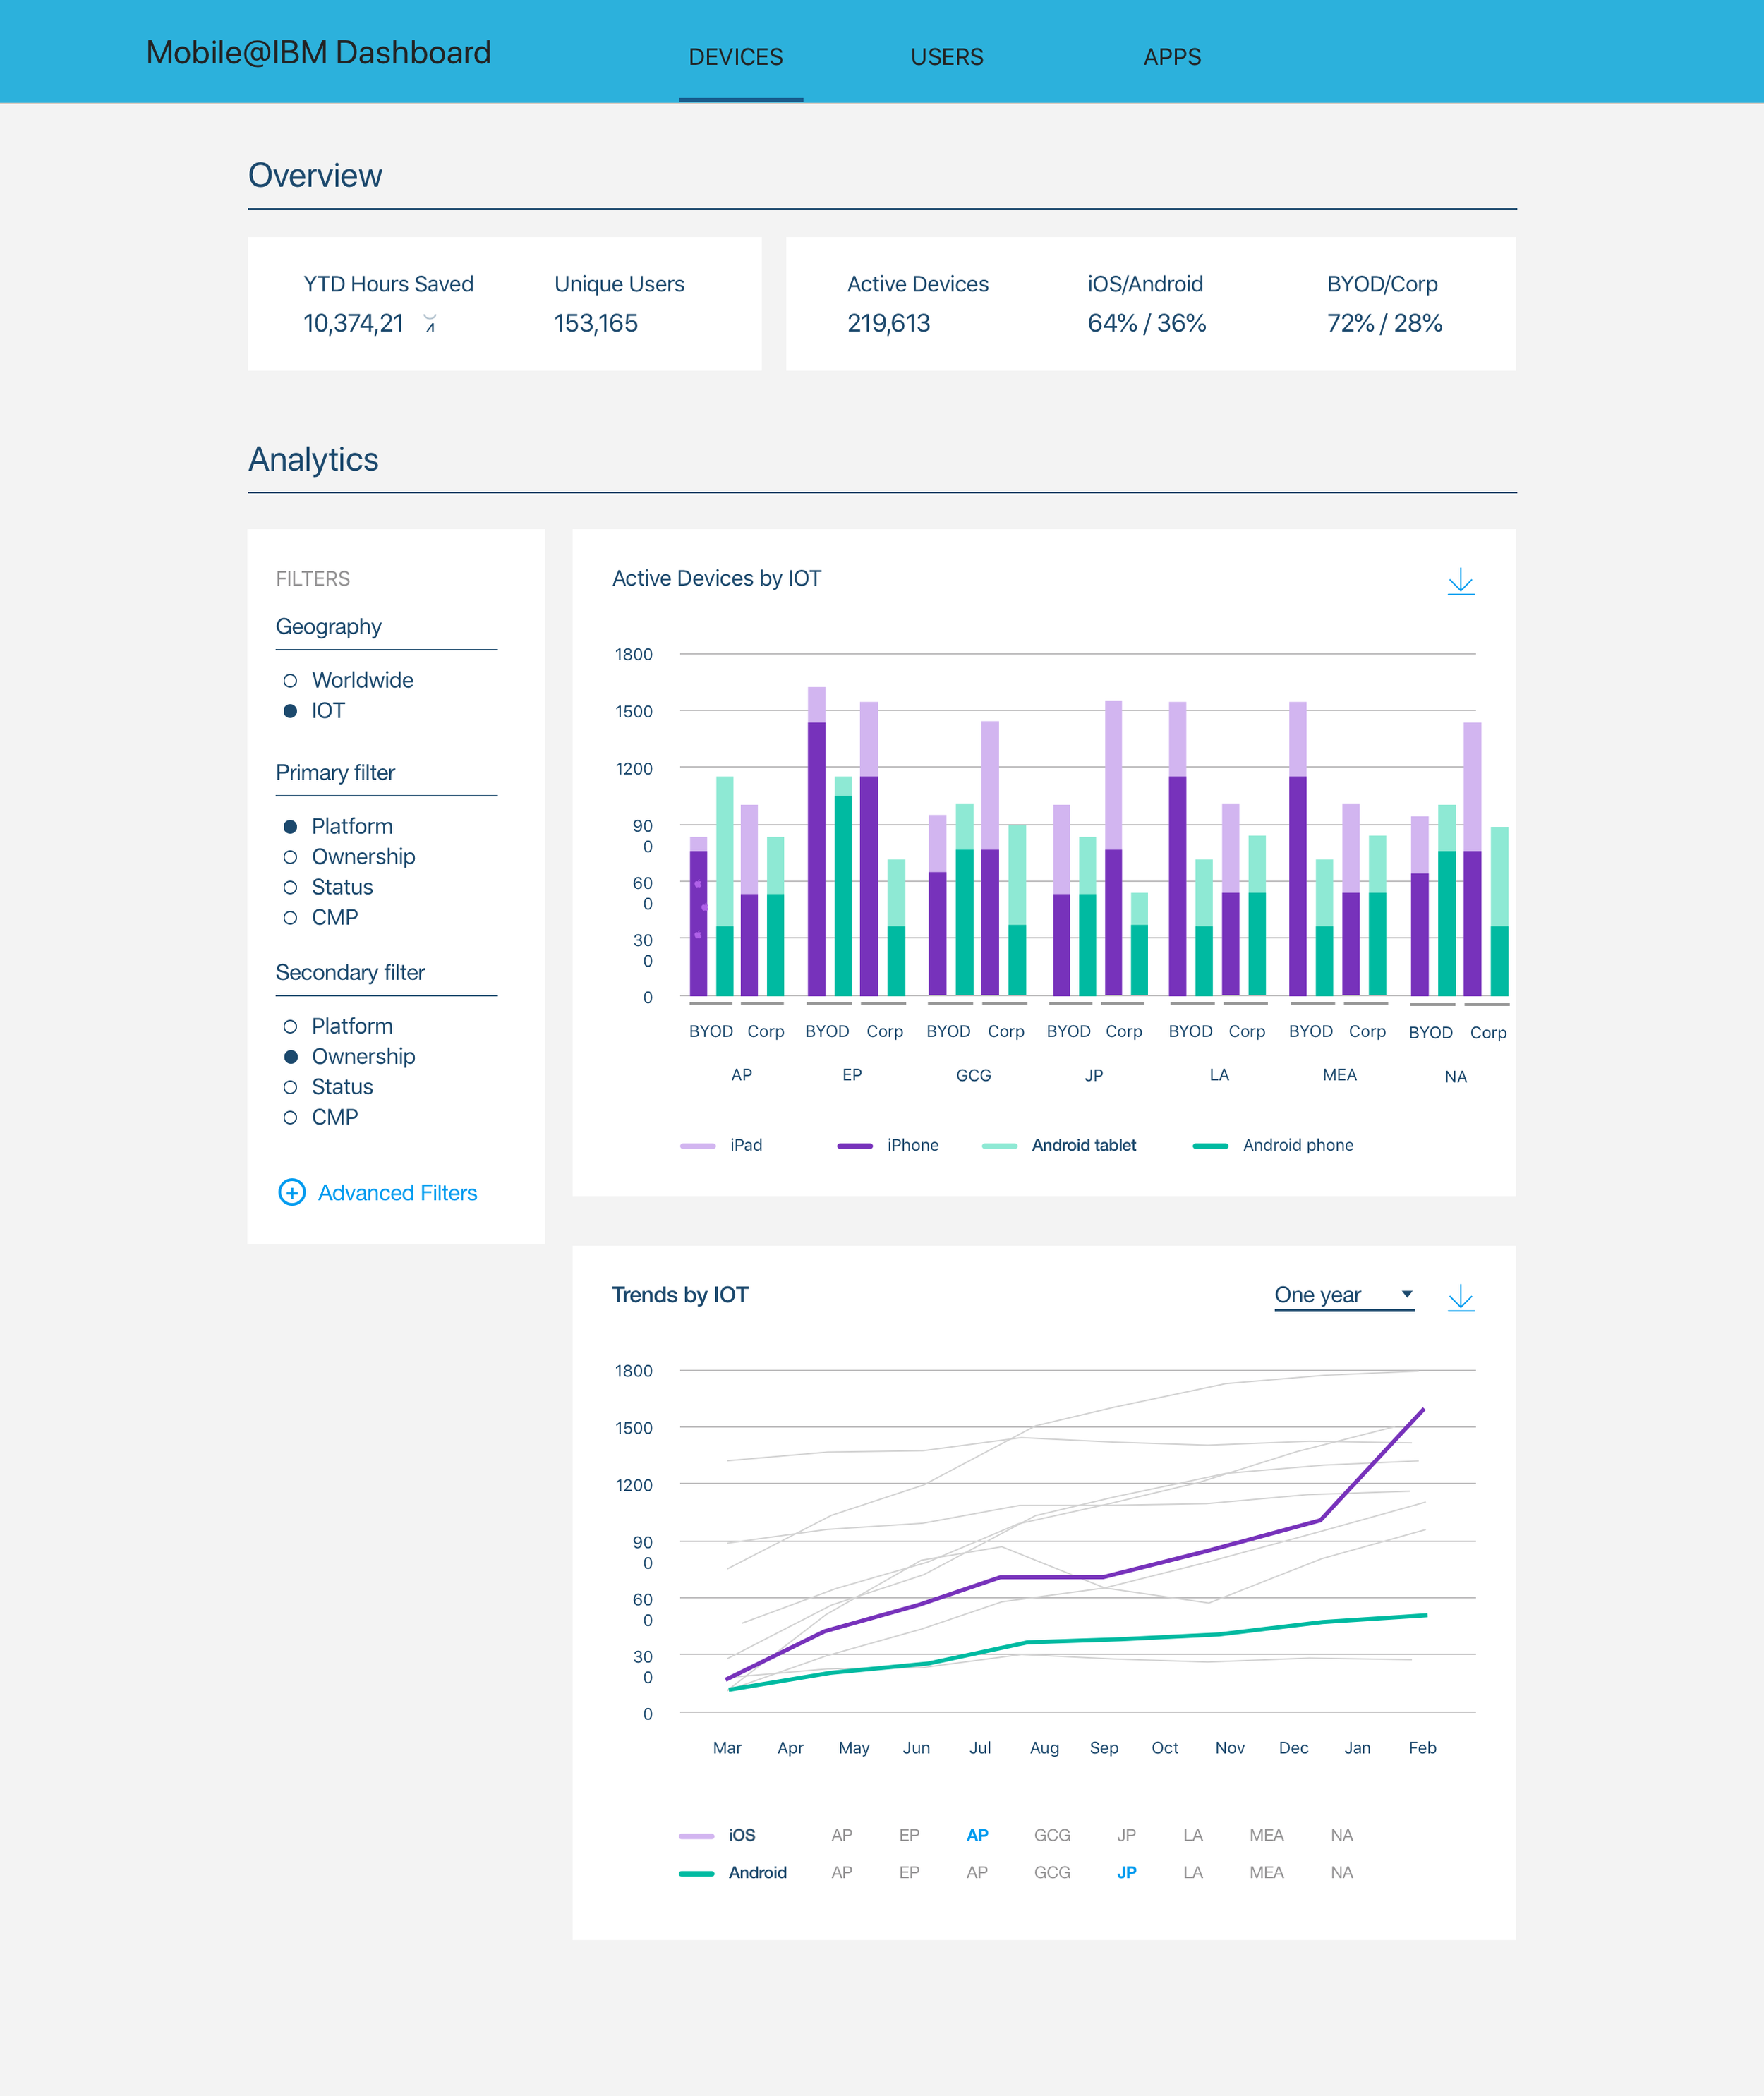
Multiple view accessible
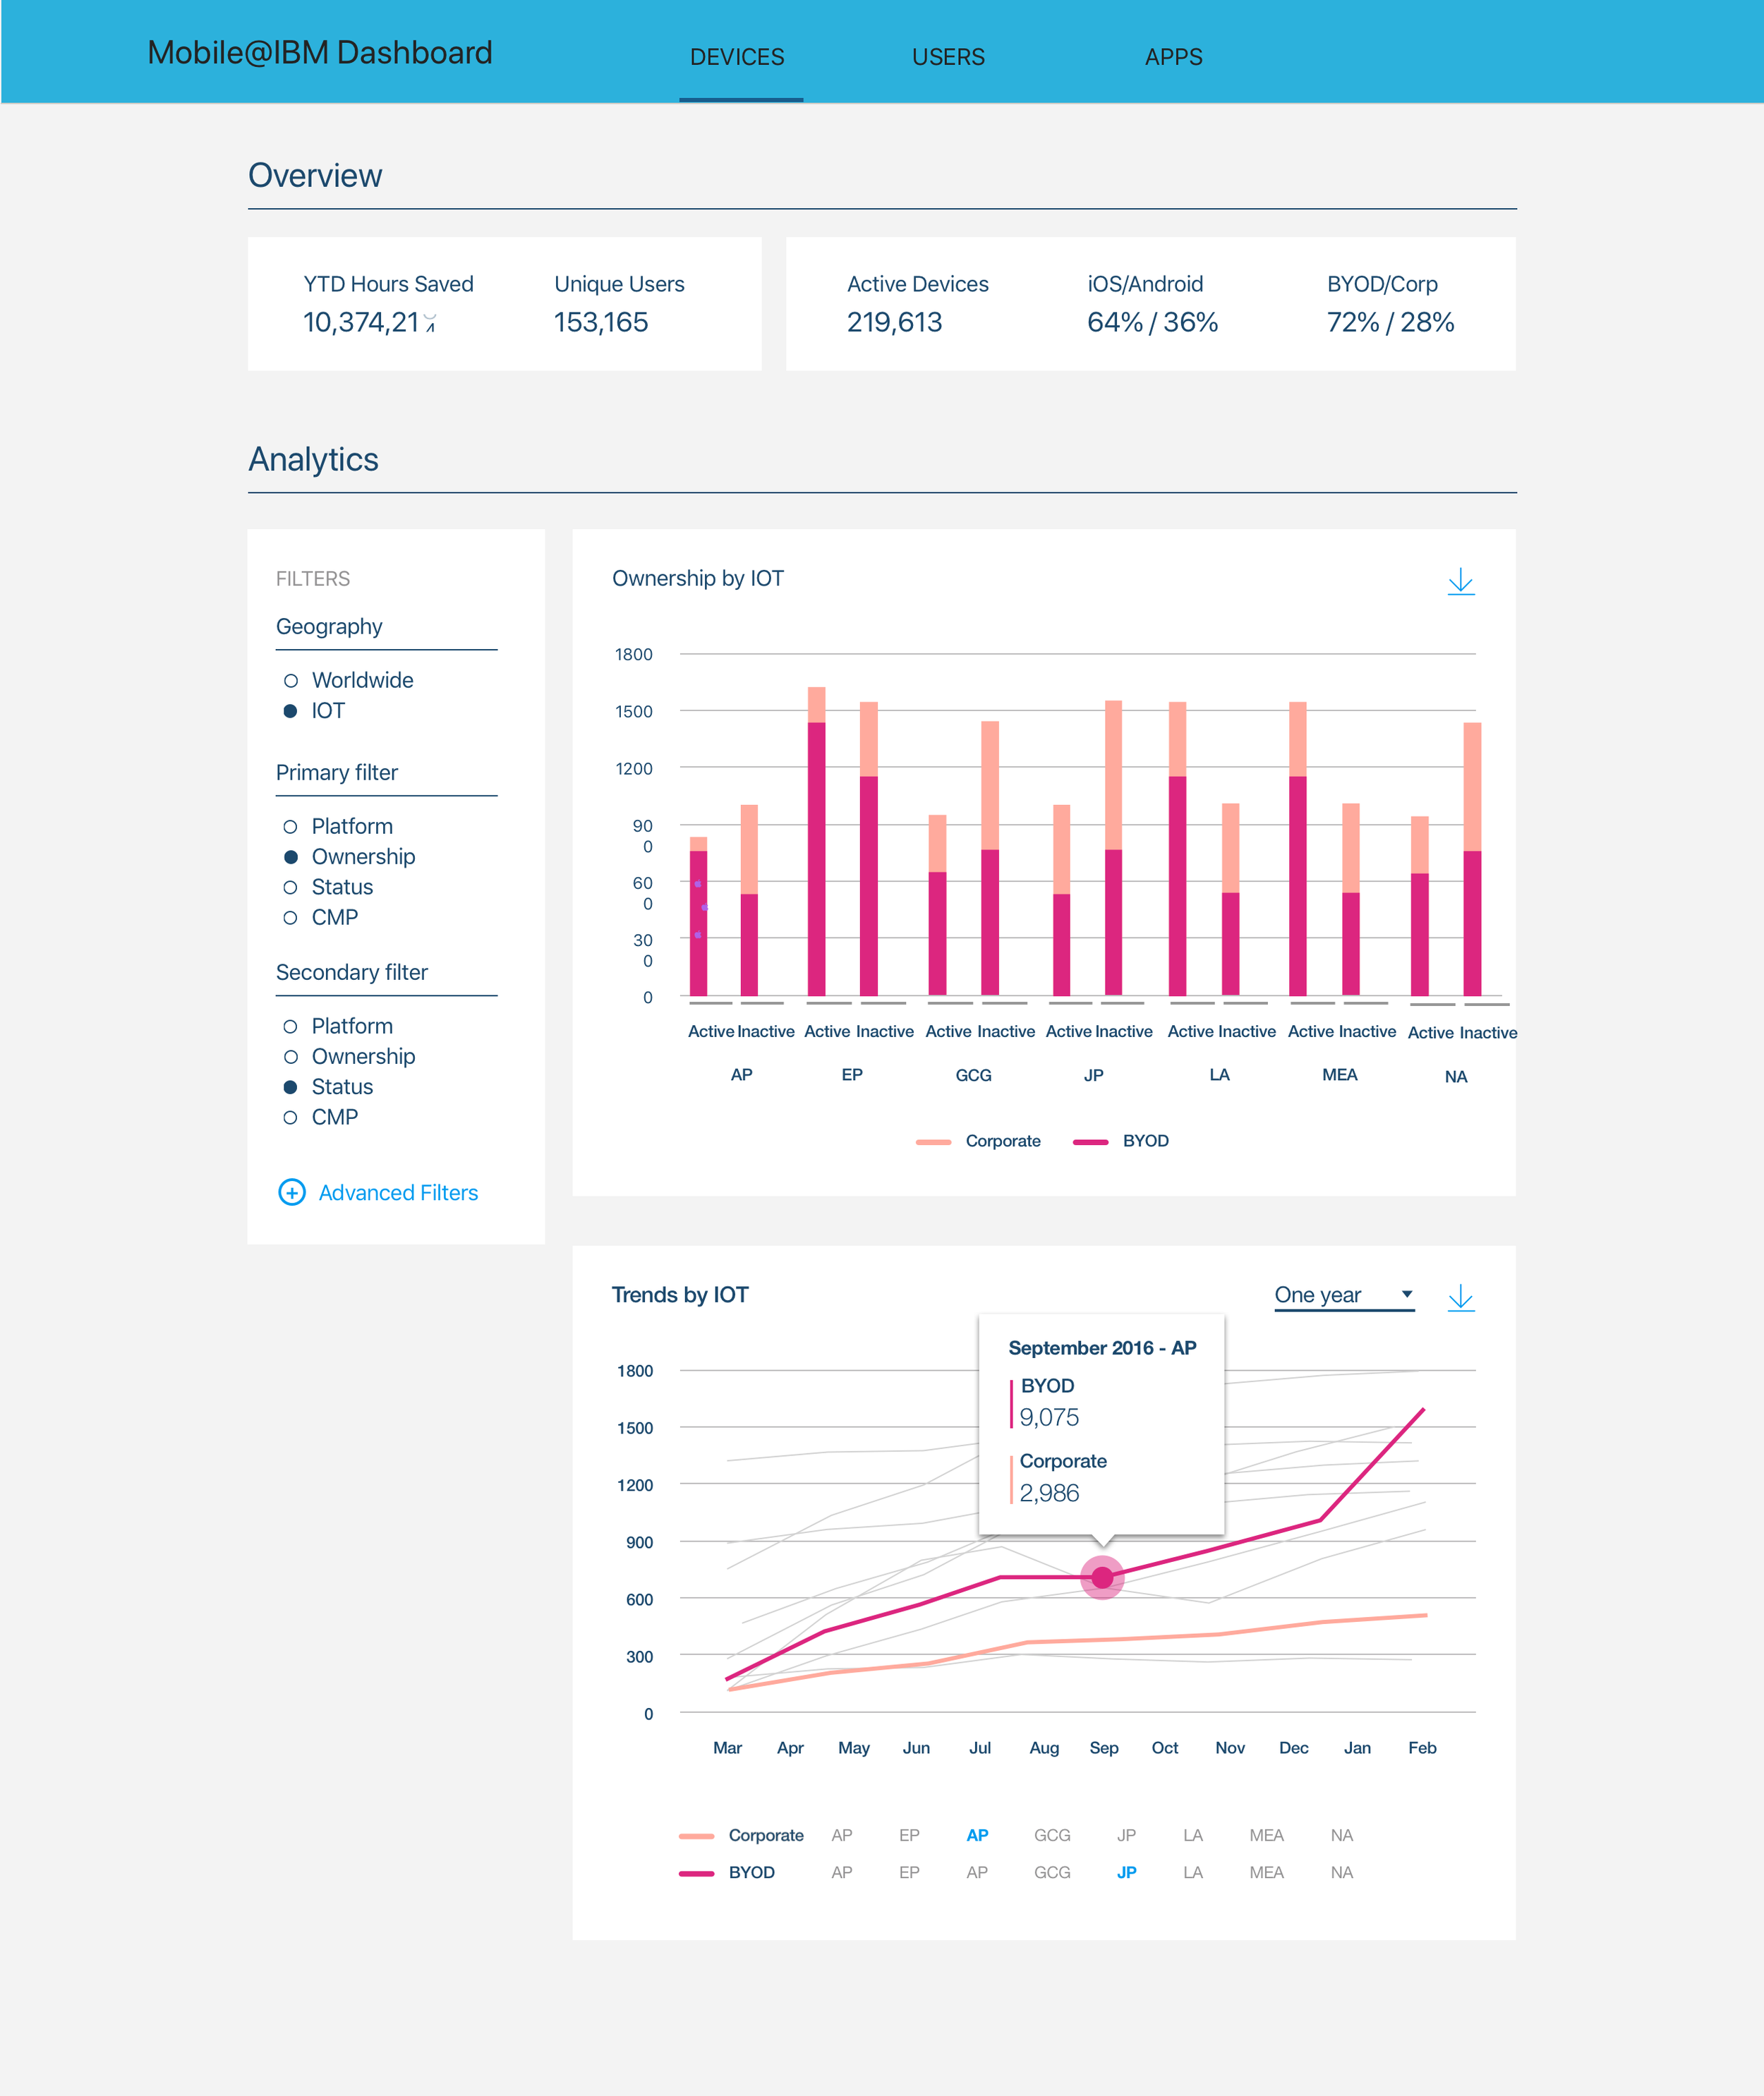
Ability to drill down to specific applications and user sets

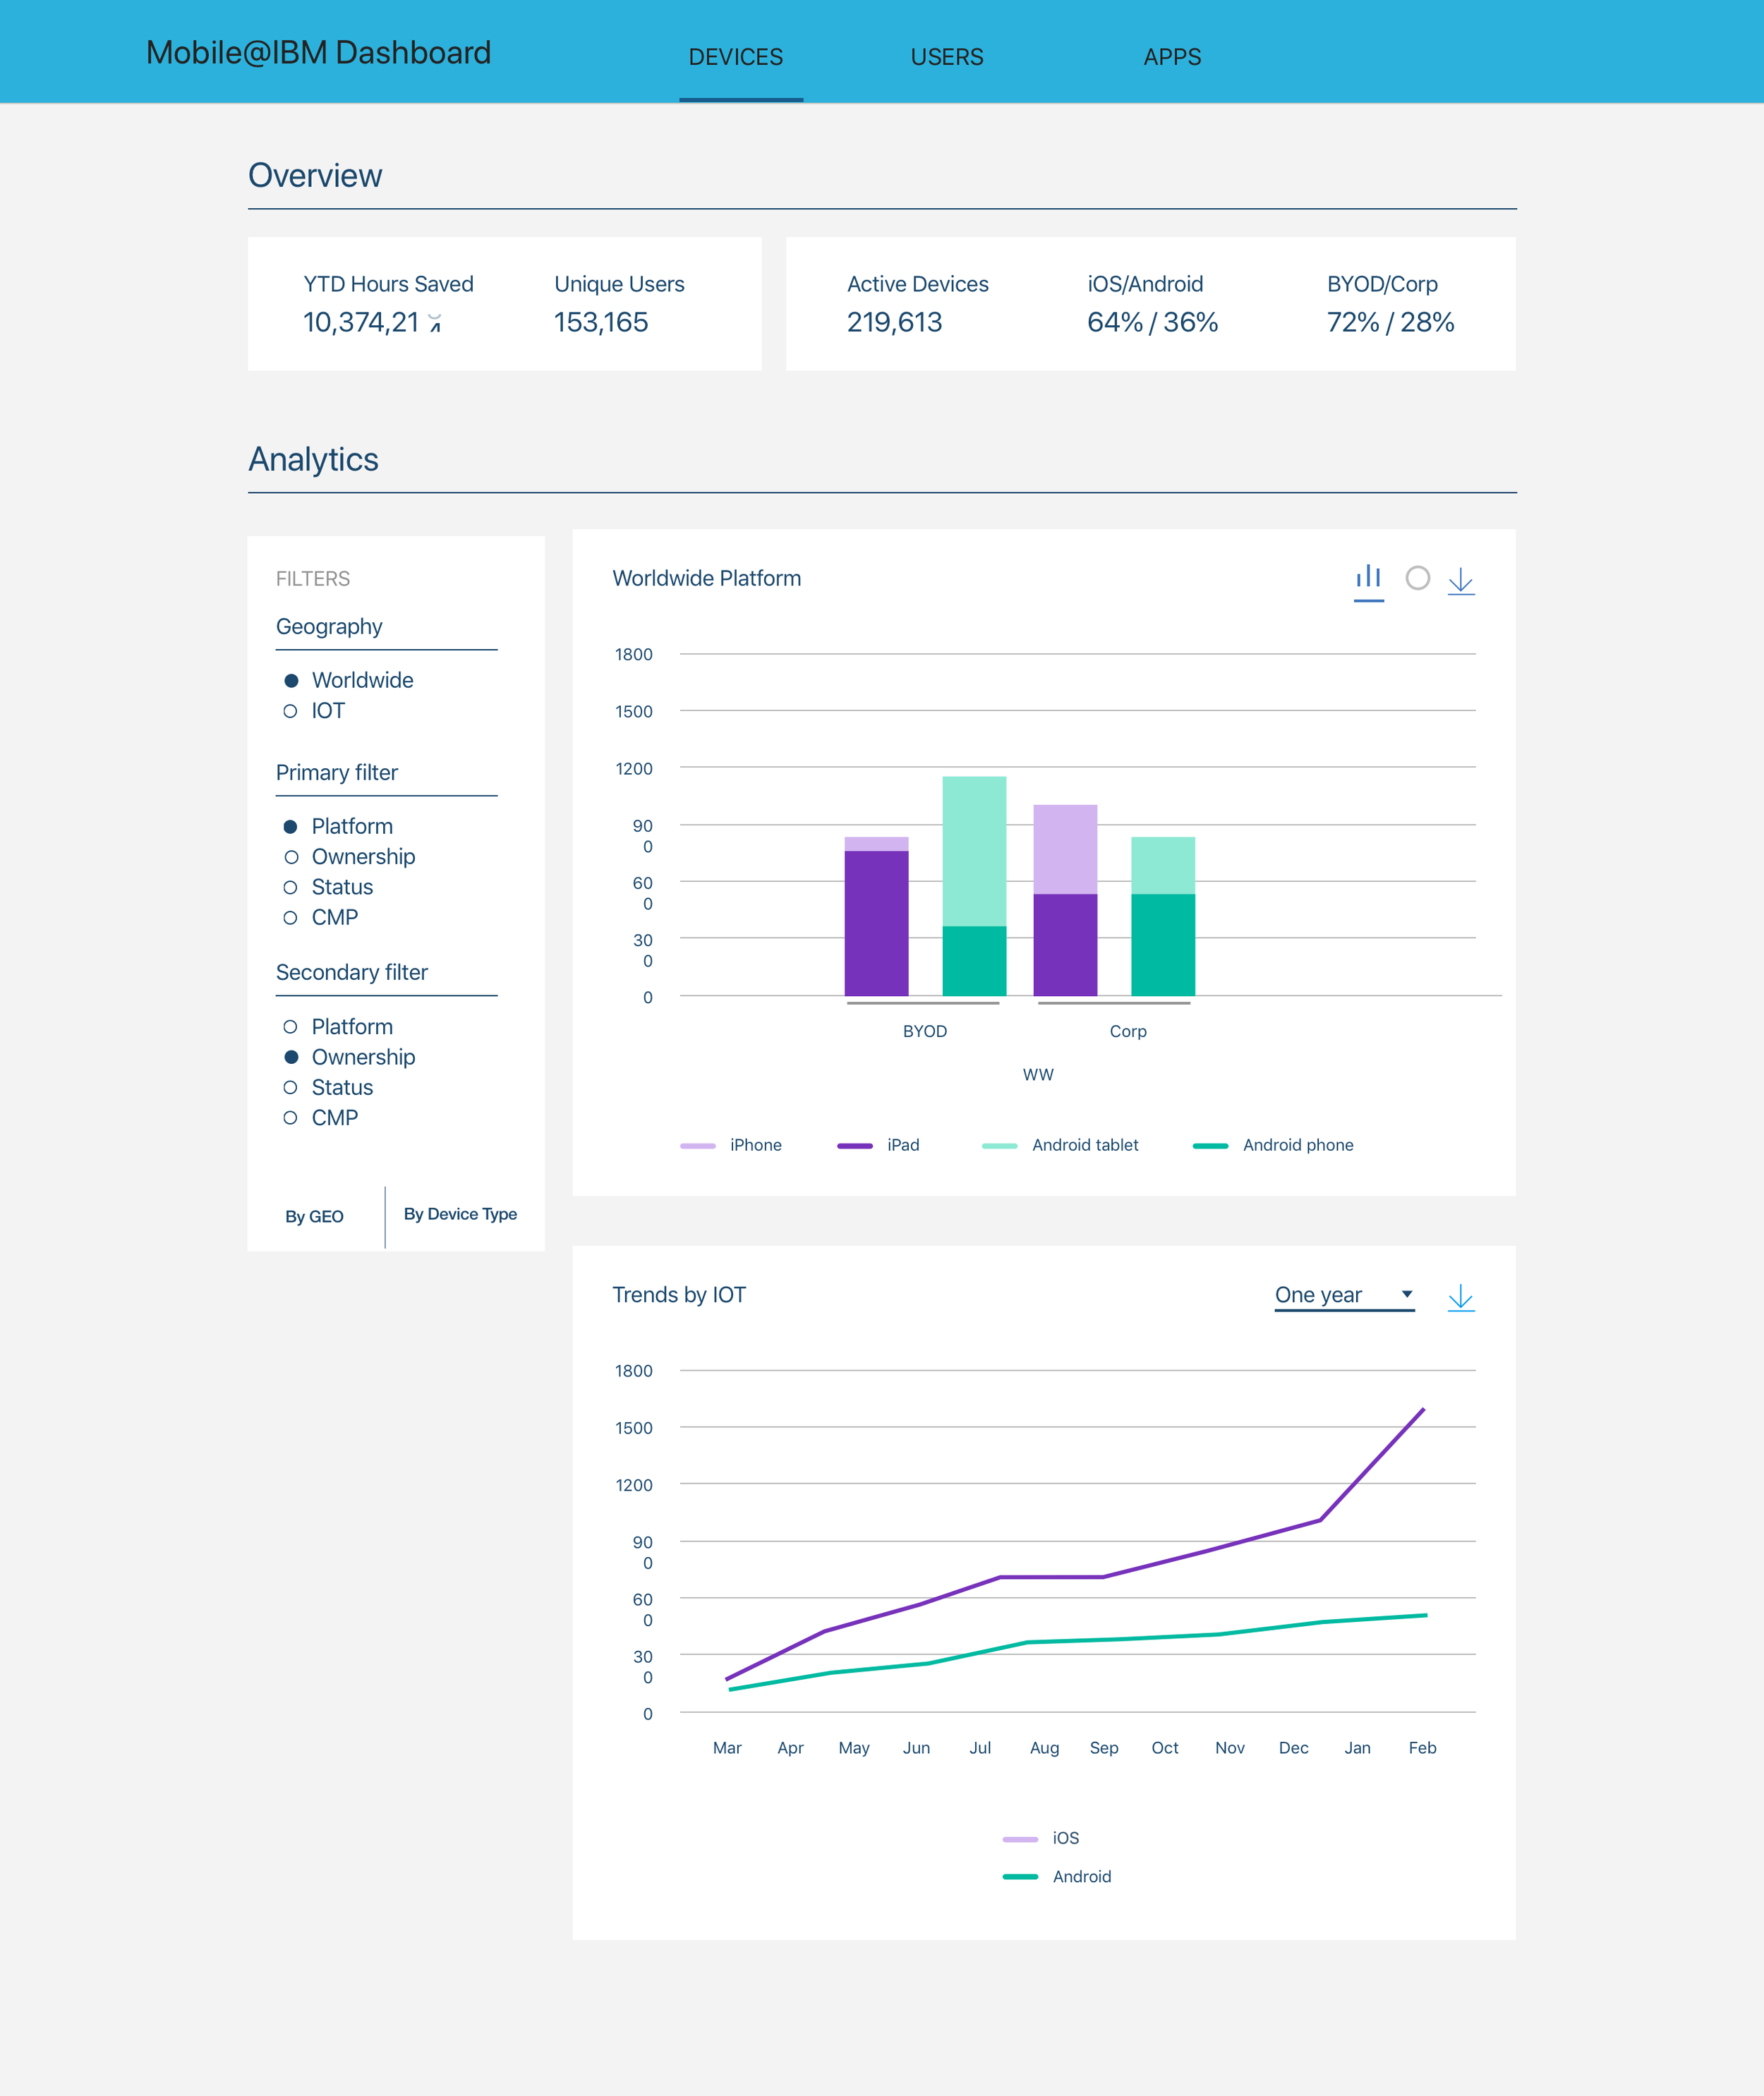
After defining the need and the available data during the workshop, I organized the data with a set of filters which would allow the interested parties to find the combination of what they wanted while making the selection of the data easy to understand.
The large set of charts the various teams needed made this job a challenge.
Through several iterations and challenging the team on what they really needed, I simplified the filters, giving more flexibility of views and comparisons.
The team plans to extend this set of views beyond mobile devices to include Macs, PCs and more, simplifying the job of the CIO to maintain and support IBM’s internal user hardware.